MOVIE of UVCS Slit on LASCO Images
CME 19990327
| Tutorials: UVCS CME Observations pdf / html | UVCS CME Catalog Pages html |
| Table 1 - General Information |
| CME ID |
Time (UT) |
PA (deg) |
Speed (km/sec) |
Acceleration (m/sec2) |
Mass (g) |
Type II RB |
X Flare |
| 19990327.165405.p306s |
16:54 |
314 |
520 |
12.6 |
1.2e+14 |
No |
No |
| Table 2 - UVCS Observation Sequence |
| FITS filename |
PA (deg) |
T i (UT) |
Tf (UT) |
Height (Rsun) |
Slit W. (arcsec) |
Exp. Time (sec) |
| d99.03.27.15:52:28.ovi.dat |
310 |
16:01:41 |
16:11:41 |
1.60 |
13 |
75 |
| 16:13:35 |
16:16:05 |
1.90 |
13 |
75 | ||
| 310 |
16:17:01 |
16:27:01 |
1.60 |
13 |
75 | |
| 16:28:59 |
16:31:29 |
1.90 |
13 |
75 | ||
| 310 |
16:32:21 |
16:42:21 |
1.60 |
13 |
75 | |
| 16:44:17 |
16:46:47 |
1.90 |
13 |
75 | ||
| 310 |
16:47:43 |
16:57:43 |
1.60 |
13 |
75 | |
| 16:59:42 |
17:02:12 |
1.90 |
13 |
75 | ||
| 310 |
17:03:04 |
17:13:04 |
1.60 |
13 |
75 | |
| 17:15:01 |
17:17:31 |
1.90 |
13 |
75 | ||
| 310 |
17:18:30 |
17:28:30 |
1.60 |
13 |
75 | |
| 17:30:26 |
17:32:56 |
1.90 |
13 |
75 | ||
| 310 |
17:33:48 |
17:43:48 |
1.60 |
13 |
75 | |
| 17:45:44 |
17:48:14 |
1.90 |
13 |
75 | ||
| 310 |
17:49:10 |
17:59:10 |
1.60 |
13 |
75 | |
| 18:01:01 |
18:03:31 |
1.90 |
13 |
75 | ||
| d99.03.27.18:03:54.ovi.dat |
310 |
18:04:28 |
18:14:28 |
1.60 |
13 |
75 |
| 18:16:24 |
18:18:54 |
1.90 |
13 |
75 | ||
| 310 |
18:19:46 |
18:29:46 |
1.60 |
13 |
75 | |
| 18:31:42 |
18:34:12 |
1.90 |
13 |
75 | ||
| 310 |
18:35:08 |
18:45:08 |
1.60 |
13 |
75 | |
| 18:46:59 |
18:49:29 |
1.90 |
13 |
75 | ||
| 310 |
18:50:26 |
19:00:26 |
1.60 |
13 |
75 | |
| 19:02:23 |
19:04:53 |
1.90 |
13 |
75 | ||
| 310 |
19:05:53 |
19:15:53 |
1.60 |
13 |
75 | |
| 19:17:51 |
19:20:21 |
1.90 |
13 |
75 | ||
| 310 |
19:21:13 |
19:31:13 |
1.60 |
13 |
75 | |
| 19:33:09 |
19:35:39 |
1.90 |
13 |
75 | ||
| 310 |
19:36:35 |
19:46:35 |
1.60 |
13 |
75 | |
| 19:48:34 |
19:51:04 |
1.90 |
13 |
75 | ||
| 310 |
19:51:56 |
20:01:56 |
1.60 |
13 |
75 | |
| 20:03:53 |
20:06:23 |
1.90 |
13 |
75 |
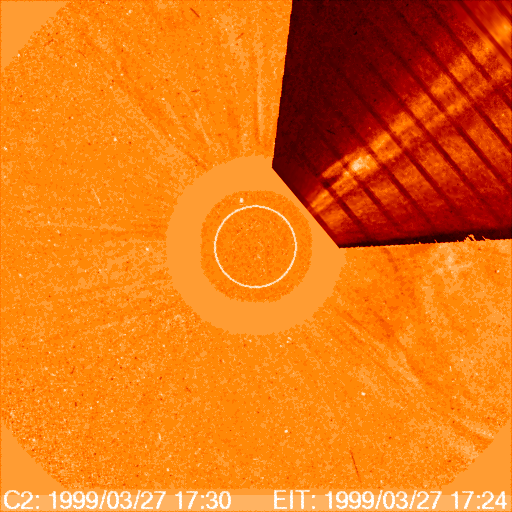
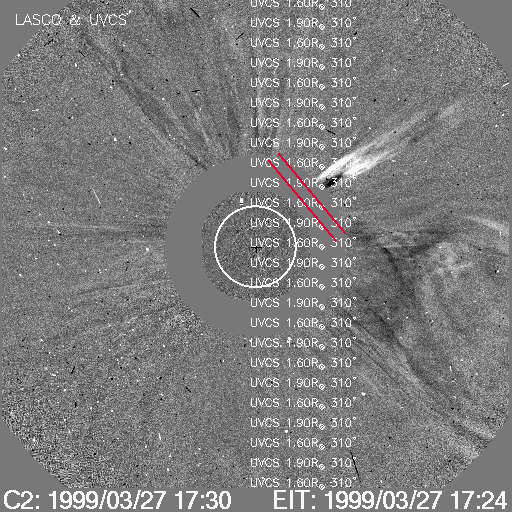
| UVCS Slit Position |
|
MOVIE of UVCS Slit on LASCO Images |
| Table 3 - UVCS Observation Wavelength Range |
| FITS filename |
Wave Min (A) |
Wave Max (A) |
| d99.03.27.15:52:28.ovi.dat |
1030.40 |
1039.20 |
| 997.500 |
1000.50 |
|
| 985.400 |
990.400 |
|
| 1212.10 |
1216.70 |
|
| 976.100 |
978.900 |
|
| 1222.70 |
1225.30 |
|
| d99.03.27.18:03:54.ovi.dat |
1030.40 |
1039.20 |
| 997.500 |
1000.50 |
|
| 985.400 |
990.400 |
|
| 1212.10 |
1216.70 |
|
| 976.100 |
978.900 |
|
| 1222.70 |
1225.30 |
| Table 4 - UV Properties |
| First Obs. | Max blue-shift (km/sec) | Max red-shift (km/sec) | Detected at (Rsun) | Lines |
| 1999/03/27 16:01 | 0 | 0 | 1.6, 1.9 |
HILya1216 OVI1032 OVI1038 |
| Images |
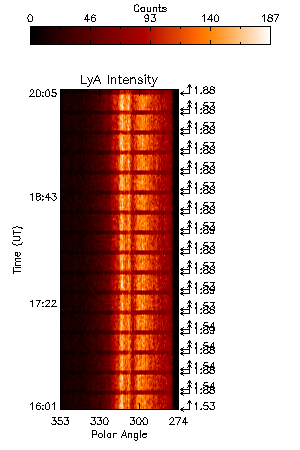
| Intensity Images |
H I Ly-alpha Intensity including background corona, small variations |
|
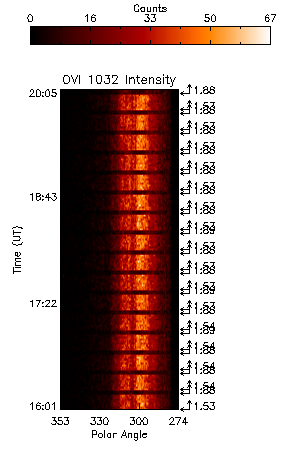
O VI 1032 Intensity including background corona, small variations |
|
| Interpretation |
| Front | No |
| Void | ? |
| Shock | No |
| Current Sheet | No |
| Prominence | ? |
| Flare O VI | No |
| Leg | ? |
| Helix | No |
| Publications |
Dobrzycka et al. 2003, ApJ, 588, 586
| Comments |
Signals have small variations, so it is difficult to single out CME material.
Last Update Wed Oct 10 12:05:49 2012