CME 19990509
| Tutorials: UVCS CME Observations pdf / html | UVCS CME Catalog Pages html |
| Table 1 - General Information |
| Tutorials: UVCS CME Observations pdf / html | UVCS CME Catalog Pages html |
| CME ID |
Time (UT) |
PA (deg) |
Speed (km/sec) |
Acceleration (m/sec2) |
Mass (g) |
Type II RB |
X Flare |
| 19990509.191618.onlyU |
No |
No |
| Table 2 - UVCS Observation Sequence |
| FITS filename |
PA (deg) |
T i (UT) |
Tf (UT) |
Height (Rsun) |
Slit W. (arcsec) |
Exp. Time (sec) |
| d99.05.09.19:16:18.ovi.dat |
90 |
09 19:16:49 |
09 19:23:29 |
1.50000 | 28 |
200 |
| Table 3 - UVCS Observation Wavelength Range |
| FITS filename |
Wave Min (A) |
Wave Max (A) |
| d99.05.09.19:16:18.ovi.dat |
1023.20 |
1043.80 |
| 980.400 |
993.400 |
|
| 1208.70 |
1220.60 |
|
| 975.800 |
979.200 |
|
| 1221.80 |
1224.90 |
| Table 4 - UV Properties |
| First Obs. | Max blue-shift (km/sec) | Max red-shift (km/sec) | Detected at (Rsun) | Lines |
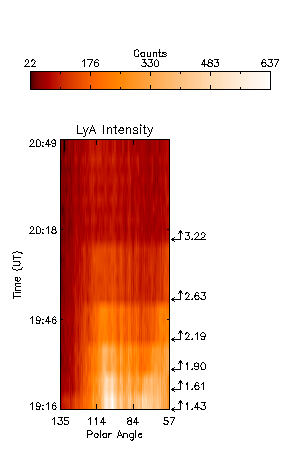
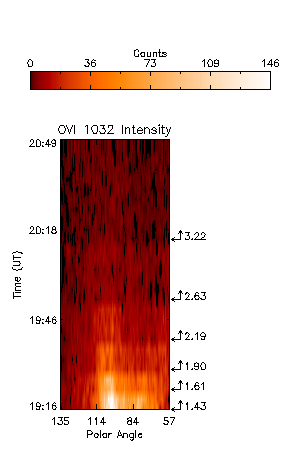
| 1999/05/09 19:16 | 0 | 0 | 1.43,1.61,1.90,2.19 |
HILya1216 OVI1032 OVI1038 |
| Images |
| Intensity Images |
|||
| Interpretation |
| Front | No |
| Void | No |
| Shock | No |
| Current Sheet | No |
| Prominence | No |
| Flare O VI | No |
| Leg | No |
| Helix | No |
| Publications |
Dobrzycka et al. 2003, ApJ, 588, 586
| Comments |
LASCO/C2 shows a narrow CME/jet at PA~95 starting 19:28 UT. The Mg X 609 line is also seen at where the H I Ly-alpha bright 'patch' is so it is uncertain if the narrow bright feature is indeed a transient. Its appearance is consistent in timing with LASCO though. See also Gilbert et al. 2001, ApJ 550, 1093
Last Update Wed Oct 10 12:12:06 2012