MOVIE of UVCS Slit on LASCO Images
CME 19990630
| Tutorials: UVCS CME Observations pdf / html | UVCS CME Catalog Pages html |
| Table 1 - General Information |
| CME ID |
Time (UT) |
PA (deg) |
Speed (km/sec) |
Acceleration (m/sec2) |
Mass (g) |
Type II RB |
X Flare |
| 19990630.043005.p272s |
04:30 |
282 |
1049 |
-27.7 |
7.8e+15* |
No |
Yes |
| Table 2 - UVCS Observation Sequence |
| FITS filename |
PA (deg) |
T i (UT) |
Tf (UT) |
Height (Rsun) |
Slit W. (arcsec) |
Exp. Time (sec) |
| d99.06.30.03:39:29.ovi.dat |
315 |
03:47:28 |
03:54:08 |
1.60 |
27 |
200 |
| 03:54:52 |
04:03:52 |
1.70 |
27 |
180 | ||
| 04:05:58 |
04:14:58 |
1.90 |
27 |
180 | ||
| 04:16:57 |
04:28:57 |
2.10 |
27 |
180 | ||
| 04:31:11 |
04:46:11 |
2.50 |
27 |
180 | ||
| 04:49:13 |
05:11:13 |
3.00 |
27 |
200 |
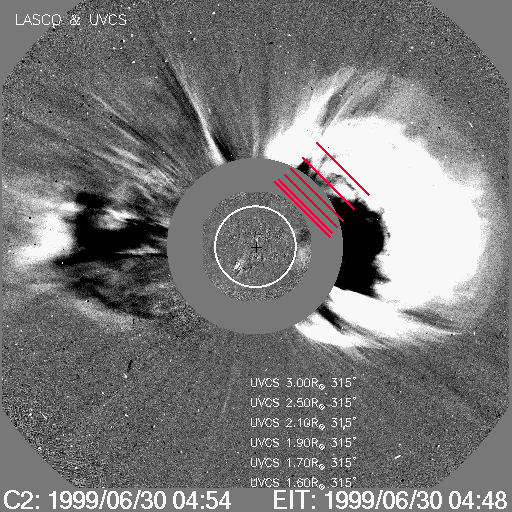
| UVCS Slit Position |
|
MOVIE of UVCS Slit on LASCO Images |
| Table 3 - UVCS Observation Wavelength Range |
| FITS filename |
Wave Min (A) |
Wave Max (A) |
| d99.06.30.03:39:29.ovi.dat |
1023.40 |
1043.70 |
| 975.700 |
992.400 |
|
| 1207.60 |
1222.90 |
| Table 4 - UV Properties |
| First Obs. | Max blue-shift (km/sec) | Max red-shift (km/sec) | Detected at (Rsun) | Lines |
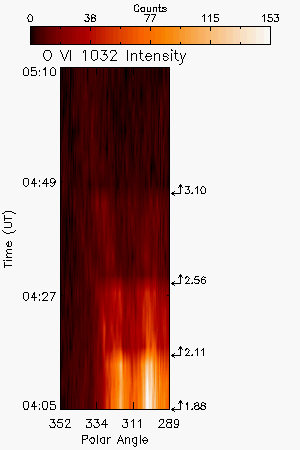
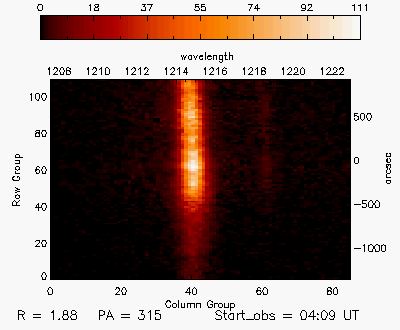
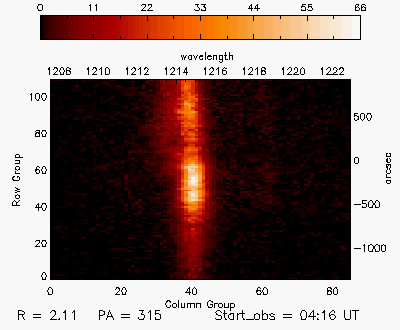
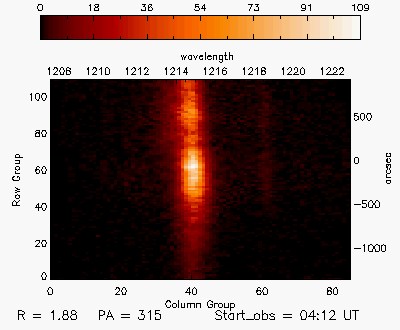
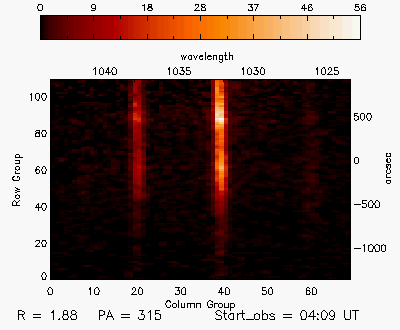
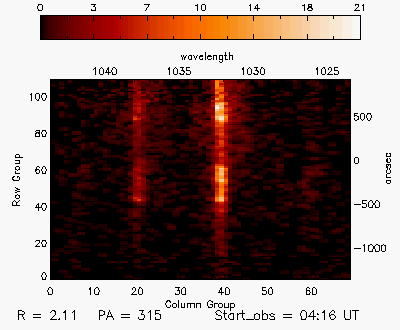
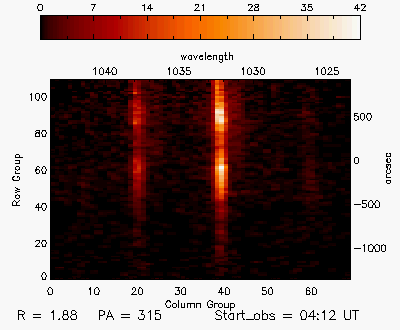
| 1999/06/30 04:12 | 605 | 607 | 1.88, 2.11 |
HILya1216 HILyb1026 OVI1032 OVI1038 |
| Images |
| Intensity Images |
||
| Plots and more |
|||||||
| Interpretation |
| Front | ? |
| Void | No |
| Shock | No |
| Current Sheet | No |
| Prominence | No |
| Flare O VI | No |
| Leg | ? |
| Helix | No |
| Comments |
The change in line profiles is similar to that in several X-class flare events UVCS observed (e.g. Apr. 21, 2002). The 'bubble'-like feature moved down the slit (toward north) with time for a few exposures.
Last Update Fri Jun 20 19:37:23 2008