MOVIE of UVCS Slit on LASCO Images
CME 19990812
| Tutorials: UVCS CME Observations pdf / html | UVCS CME Catalog Pages html |
| Table 1 - General Information |
| CME ID |
Time (UT) |
PA (deg) |
Speed (km/sec) |
Acceleration (m/sec2) |
Mass (g) |
Type II RB |
X Flare |
| 19990812.003005.p309g |
00:30 |
284 |
521 |
-6.2 |
6.0e+15 |
No |
Yes |
| Table 2 - UVCS Observation Sequence |
| FITS filename |
PA (deg) |
T i (UT) |
Tf (UT) |
Height (Rsun) |
Slit W. (arcsec) |
Exp. Time (sec) |
| d99.08.12.01:27:26.ovi.dat |
260 |
01:35:40 |
01:44:40 |
1.70 |
28 |
180 |
| 275 |
01:47:35 |
01:56:35 |
1.70 |
28 |
180 | |
| 290 |
01:59:34 |
02:08:34 |
1.70 |
28 |
180 | |
| 305 |
02:11:34 |
02:20:34 |
1.70 |
28 |
180 | |
| 320 |
02:23:33 |
02:32:33 |
1.70 |
28 |
180 | |
| 02:34:38 |
02:43:38 |
1.80 |
28 |
180 | ||
| 305 |
02:46:32 |
02:55:32 |
1.80 |
28 |
180 | |
| 290 |
02:58:29 |
03:07:29 |
1.80 |
28 |
180 | |
| 275 |
03:10:31 |
03:19:31 |
1.80 |
28 |
180 | |
| 260 |
03:22:28 |
03:31:28 |
1.80 |
28 |
180 | |
| 03:33:36 |
03:42:36 |
1.90 |
28 |
180 | ||
| 275 |
03:45:29 |
03:54:29 |
1.90 |
28 |
180 | |
| 290 |
03:57:29 |
04:06:29 |
1.90 |
28 |
180 | |
| 305 |
04:09:28 |
04:18:28 |
1.90 |
28 |
180 | |
| 320 |
04:21:29 |
04:30:29 |
1.90 |
28 |
180 | |
| 04:32:33 |
04:41:33 |
2.09 |
28 |
180 | ||
| 305 |
04:44:26 |
04:53:26 |
2.09 |
28 |
180 | |
| 290 |
04:56:26 |
05:05:26 |
2.09 |
28 |
180 | |
| 275 |
05:08:23 |
05:17:23 |
2.09 |
28 |
180 | |
| 260 |
05:20:25 |
05:29:25 |
2.09 |
28 |
180 | |
| 05:31:30 |
05:40:30 |
2.39 |
28 |
180 | ||
| 275 |
05:43:24 |
05:52:24 |
2.39 |
28 |
180 | |
| 290 |
05:55:23 |
06:04:23 |
2.39 |
28 |
180 | |
| 305 |
06:07:23 |
06:16:23 |
2.39 |
28 |
180 | |
| 320 |
06:19:22 |
06:28:22 |
2.39 |
28 |
180 | |
| 06:30:27 |
06:39:27 |
2.69 |
28 |
180 |
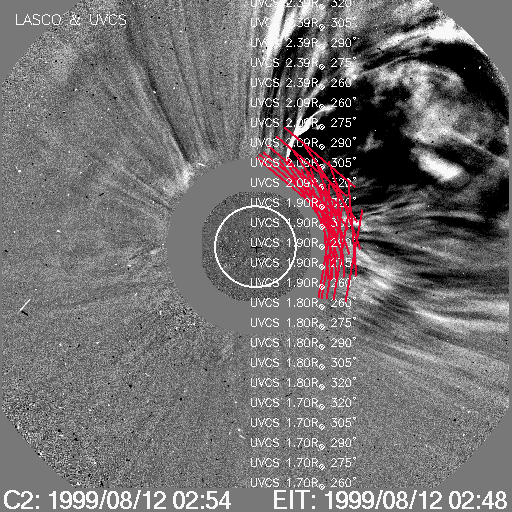
| UVCS Slit Position |
|
MOVIE of UVCS Slit on LASCO Images |
| Table 3 - UVCS Observation Wavelength Range |
| FITS filename |
Wave Min (A) |
Wave Max (A) |
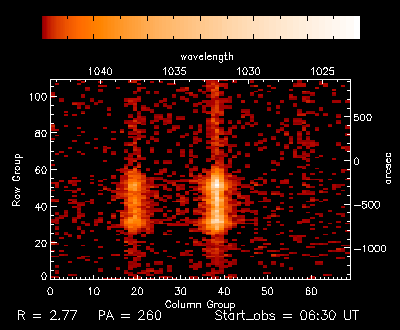
| d99.08.12.01:27:26.ovi.dat |
1023.10 |
1043.40 |
| 997.500 |
1000.30 |
|
| 971.800 |
985.700 |
|
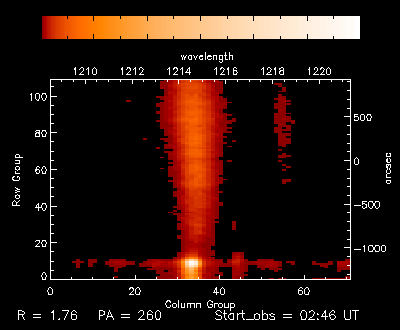
| 1208.50 |
1221.30 |
| Table 4 - UV Properties |
| First Obs. | Max blue-shift (km/sec) | Max red-shift (km/sec) | Detected at (Rsun) | Lines |
| 1999/08/12 01:59 | 0 | 0 | 1.65, 1.99, 1.90, 2.10, 2.46, 2.78 |
HILya1216 HILyb1026 HILyg973 CIII977 OVI1032 OVI1038 OV1214 OV1218 |
| Images |
| Plots and more |
Transient blob seen in LyA, C III, and possibly O V]1218.4 and [O V]1213.9 |
Enhanced emission seen in OVI doublets only, not seen in cooler lines such as LyA, and CIII. |
|
| Interpretation |
| Front | No |
| Void | No |
| Shock | No |
| Current Sheet | ? |
| Prominence | Yes |
| Flare O VI | No |
| Leg | No |
| Helix | No |
| Comments |
Data were obtained from 5 PAs (260,275,290,305,320) and 6 heights for each PA. Events seen at the PA=290-320 range. LASCO movie and UVCS data sequence shown here do not cover all PAs and heights. May have Ly Gamma too.
Last Update Mon Nov 16 11:03:49 2009