CME 19990826
| Tutorials: UVCS CME Observations pdf / html | UVCS CME Catalog Pages html |
| Table 1 - General Information |
| CME ID |
Time (UT) |
PA (deg) |
Speed (km/sec) |
Acceleration (m/sec2) |
Mass (g) |
Type II RB |
X Flare |
| 19990826.210749.onlyU |
No |
No |
| Table 2 - UVCS Observation Sequence |
| FITS filename |
PA (deg) |
T i (UT) |
Tf (UT) |
Height (Rsun) |
Slit W. (arcsec) |
Exp. Time (sec) |
| d99.08.26.21:07:49.ovi.dat |
292 |
26 21:08:22 |
26 21:25:02 |
1.70000 |
13 |
100 |
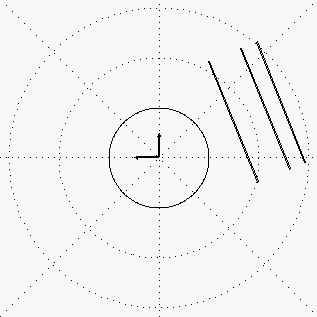
| UVCS Slit Position |
|
| Table 3 - UVCS Observation Wavelength Range |
| FITS filename |
Wave Min (A) |
Wave Max (A) |
| d99.08.26.21:07:49.ovi.dat |
1024.30 |
1039.20 |
| 997.400 |
1000.40 |
|
| 989.300 |
992.900 |
|
| 1205.10 |
1208.40 |
|
| 975.900 |
985.900 |
|
| 1211.50 |
1220.70 |
| Table 4 - UV Properties |
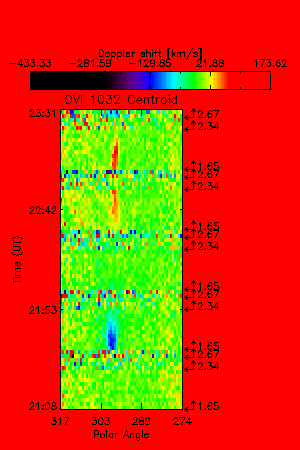
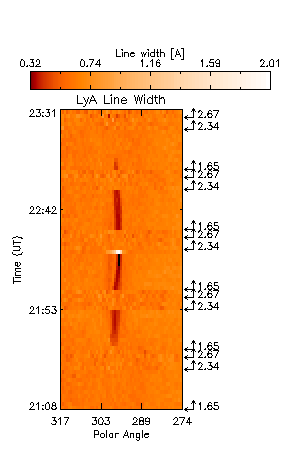
| First Obs. | Max blue-shift (km/sec) | Max red-shift (km/sec) | Detected at (Rsun) | Lines |
| 1999/08/26 21:37 | 150 | 100 | 1.65 |
HILya1216 HILyb1026 CIII977 OVI1032 OVI1038 NIII990 |
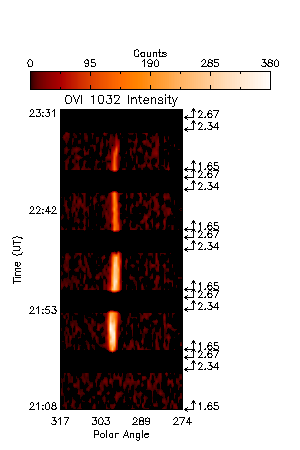
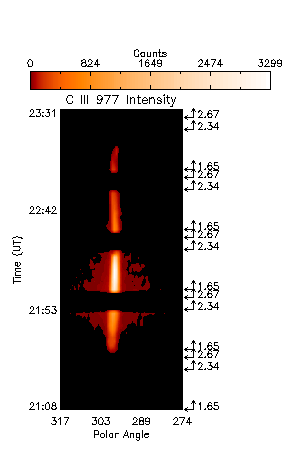
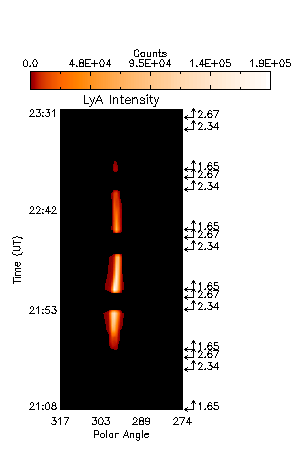
| Images |
| Intensity Images |
OVI 1032 centroid showing blue shift at the beginning, turning to red shift at the end. |
|||||
| Interpretation |
| Front | No |
| Void | No |
| Shock | No |
| Current Sheet | No |
| Prominence | Yes |
| Flare O VI | No |
| Leg | No |
| Helix | No |
| Publications |
Ko et al. 2005, ApJ, vol.623, p519.
| Comments |
This is a coronal jet event. CME not listed in LASCO catalog
Last Update Wed May 2 16:38:00 2012