MOVIE of UVCS Slit on LASCO Images
CME 19990905
| Tutorials: UVCS CME Observations pdf / html | UVCS CME Catalog Pages html |
| Table 1 - General Information |
| CME ID |
Time (UT) |
PA (deg) |
Speed (km/sec) |
Acceleration (m/sec2) |
Mass (g) |
Type II RB |
X Flare |
| 19990905.035428.p225g |
03:54 |
251 |
465 |
6.3 |
1.6e+15 |
No |
No |
| Table 2 - UVCS Observation Sequence |
| FITS filename |
PA (deg) |
T i (UT) |
Tf (UT) |
Height (Rsun) |
Slit W. (arcsec) |
Exp. Time (sec) |
| d99.09.05.03:35:49.ovi.dat |
315 |
03:36:19 |
03:42:59 |
1.50 |
27 |
200 |
| 03:43:47 |
03:50:27 |
1.60 |
27 |
200 | ||
| 315 |
03:51:11 |
04:00:11 |
1.70 |
27 |
180 |
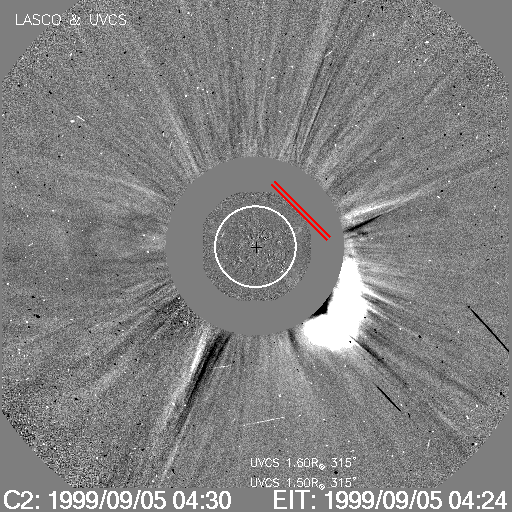
| UVCS Slit Position |
|
MOVIE of UVCS Slit on LASCO Images |
| Table 3 - UVCS Observation Wavelength Range |
| FITS filename |
Wave Min (A) |
Wave Max (A) |
| d99.09.05.03:35:49.ovi.dat |
1023.10 |
1043.40 |
| 997.500 |
1000.30 |
|
| 971.800 |
985.700 |
|
| 1208.50 |
1221.30 |
| Table 4 - UV Properties |
| First Obs. | Max blue-shift (km/sec) | Max red-shift (km/sec) | Detected at (Rsun) | Lines |
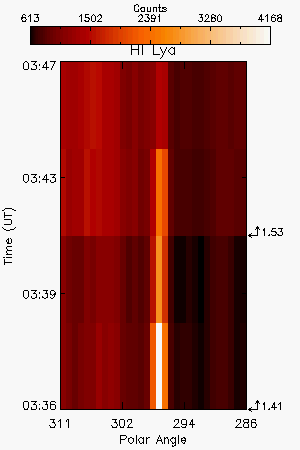
| 1999/09/05 03:36 | 45 | 0 | 1.41,1.53 |
HILya1216 CIII977 OV1214 OV1218 |
| Images |
| Intensity Images |
||
| Interpretation |
| Front | No |
| Void | No |
| Shock | No |
| Current Sheet | No |
| Prominence | Yes |
| Flare O VI | No |
| Leg | ? |
| Helix | No |
| Comments |
O V], [O V] possibly seen at 1.41 Rs. Only seen in 4 exposures at 1.41 and 1.53 Rs with one narrorw line-width blob. Maybe the narrow jet north of the main CME.
Last Update Mon Nov 23 11:44:17 2009