MOVIE of UVCS Slit on LASCO Images
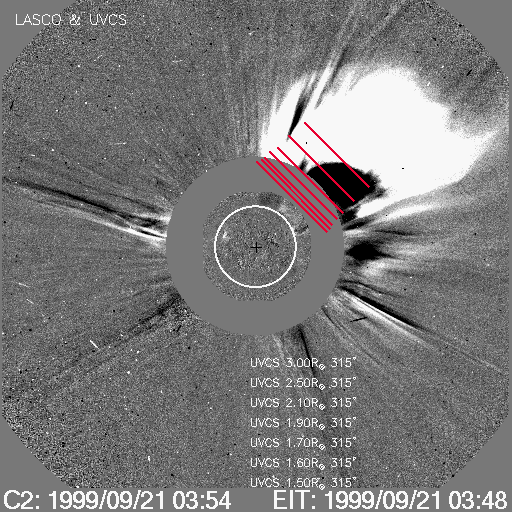
CME 19990921
| Tutorials: UVCS CME Observations pdf / html | UVCS CME Catalog Pages html |
| Table 1 - General Information |
| CME ID |
Time (UT) |
PA (deg) |
Speed (km/sec) |
Acceleration (m/sec2) |
Mass (g) |
Type II RB |
X Flare |
| 19990921.033005.p299g |
03:30 |
298 |
1402 |
0.7 |
4.6e+15* |
Yes |
Yes |
| Table 2 - UVCS Observation Sequence |
| FITS filename |
PA (deg) |
T i (UT) |
Tf (UT) |
Height (Rsun) |
Slit W. (arcsec) |
Exp. Time (sec) |
| d99.09.21.03:08:04.ovi.dat |
315 |
03:08:34 |
03:15:14 |
1.50 |
27 |
200 |
| 03:15:58 |
03:22:38 |
1.60 |
27 |
200 | ||
| 315 |
03:23:26 |
03:32:26 |
1.70 |
27 |
180 | |
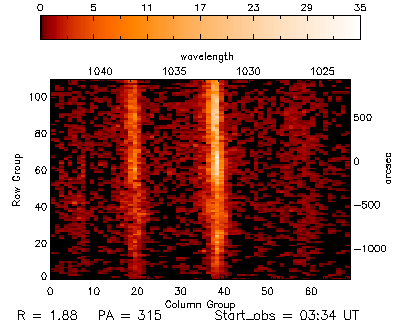
| 03:34:33 |
03:43:33 |
1.90 |
27 |
180 | ||
| 315 |
03:45:32 |
03:57:32 |
2.10 |
27 |
180 | |
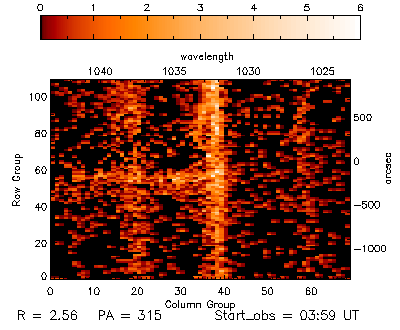
| 03:59:45 |
04:14:45 |
2.50 |
27 |
180 | ||
| 315 |
04:17:48 |
04:39:48 |
3.00 |
27 |
200 |
| UVCS Slit Position |
|
MOVIE of UVCS Slit on LASCO Images |
| Table 3 - UVCS Observation Wavelength Range |
| FITS filename |
Wave Min (A) |
Wave Max (A) |
| d99.09.21.03:08:04.ovi.dat |
1023.10 |
1043.40 |
| 997.500 |
1000.30 |
|
| 971.800 |
985.700 |
|
| 1208.50 |
1221.30 |
| Table 4 - UV Properties |
| First Obs. | Max blue-shift (km/sec) | Max red-shift (km/sec) | Detected at (Rsun) | Lines |
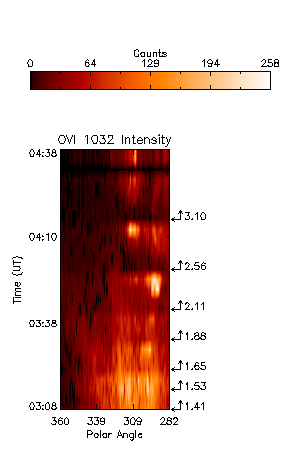
| 1999/09/21 03:19 | 1126 | 0 | 1.41,1.53,1.65,1.88,2.11,2.56,3.10 |
HILya1216 HILyb1026 HILyg973 CIII977 OVI1032 OVI1038 OV1214 OV1218 |
| Images |
| Intensity Images |
||
| Plots and more |
Possible front/shock passing as seen in the diffused OVI line profile |
||
| Interpretation |
| Front | ? |
| Void | No |
| Shock | ? |
| Current Sheet | No |
| Prominence | Yes |
| Flare O VI | No |
| Leg | No |
| Helix | No |
Last Update Thu May 10 14:47:39 2012