MOVIE of UVCS Slit on LASCO Images
CME 20000131
| Tutorials: UVCS CME Observations pdf / html | UVCS CME Catalog Pages html |
| Table 1 - General Information |
| CME ID |
Time (UT) |
PA (deg) |
Speed (km/sec) |
Acceleration (m/sec2) |
Mass (g) |
Type II RB |
X Flare |
| 20000131.194822.p027s |
19:48 |
30 |
509 |
2.3* |
2.1e+15 |
No |
No |
| Table 2 - UVCS Observation Sequence |
| FITS filename |
PA (deg) |
T i (UT) |
Tf (UT) |
Height (Rsun) |
Slit W. (arcsec) |
Exp. Time (sec) |
| d00.01.31.16:58:51.ovi.dat |
30 |
19:21:39 |
19:27:39 |
1.90 |
13 |
120 |
| d00.01.31.19:28:10.ovi.dat |
30 |
19:57:22 |
20:03:22 |
1.90 |
13 |
120 |
| 20:33:07 |
20:39:07 |
1.90 |
13 |
120 | ||
| 30 |
21:08:49 |
21:14:49 |
1.90 |
13 |
120 | |
| 21:44:32 |
21:50:32 |
1.90 |
13 |
120 | ||
| d00.01.31.21:51:04.ovi.dat |
30 |
22:20:17 |
22:26:17 |
1.90 |
13 |
120 |
| 22:55:59 |
23:01:59 |
1.90 |
13 |
120 | ||
| 30 |
23:31:42 |
23:37:42 |
1.90 |
13 |
120 |
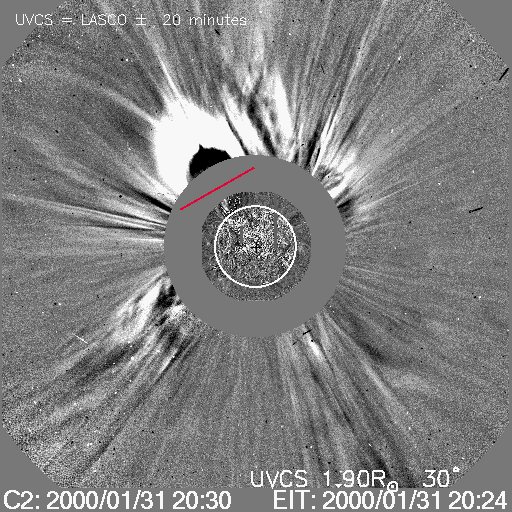
| UVCS Slit Position |
|
MOVIE of UVCS Slit on LASCO Images |
| Table 3 - UVCS Observation Wavelength Range |
| FITS filename |
Wave Min (A) |
Wave Max (A) |
| d00.01.31.16:58:51.ovi.dat |
1063.40 |
1068.10 |
| 1029.50 |
1044.40 |
|
| 1024.30 |
1027.70 |
|
| 987.500 |
993.400 |
|
| 1204.60 |
1210.10 |
|
| 975.900 |
985.600 |
|
| d00.01.31.19:28:10.ovi.dat |
1063.40 |
1068.10 |
| 1029.50 |
1044.40 |
|
| 1024.30 |
1027.70 |
|
| 987.500 |
993.400 |
|
| 1204.60 |
1210.10 |
|
| 975.900 |
985.600 |
|
| d00.01.31.21:51:04.ovi.dat |
1063.40 |
1068.10 |
| 1029.50 |
1044.40 |
|
| 1024.30 |
1027.70 |
|
| 987.500 |
993.400 |
|
| 1204.60 |
1210.10 |
|
| 975.900 |
985.600 |
| Table 4 - UV Properties |
| First Obs. | Max blue-shift (km/sec) | Max red-shift (km/sec) | Detected at (Rsun) | Lines |
| 2000/01/31 19:00 | 1.54,1.89 |
HILya1216 HILyb1026 OVI1032 OVI1038 | ||
| Images |
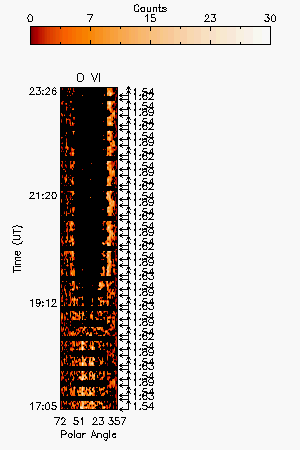
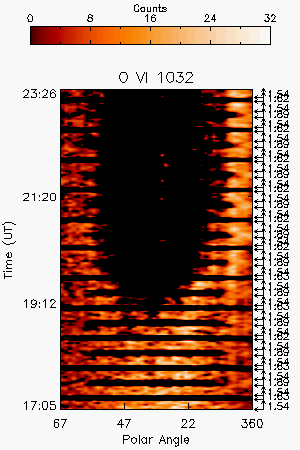
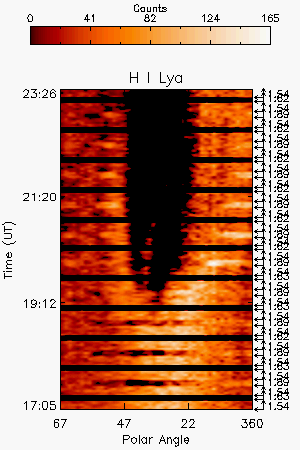
| Intensity Images |
O VI 1032: 2 heights and 2 grating positions, Difference Image |
H I Ly-alpha: 2 heights and 2 grating positions, Difference Image |
||
| Plots and more |
||
| Interpretation |
| Front | Yes |
| Void | ? |
| Shock | No |
| Current Sheet | No |
| Prominence | No |
| Flare O VI | No |
| Leg | No |
| Helix | No |
| Publications |
Bemporad et al. 2007, ApJ 655, 576
| Comments |
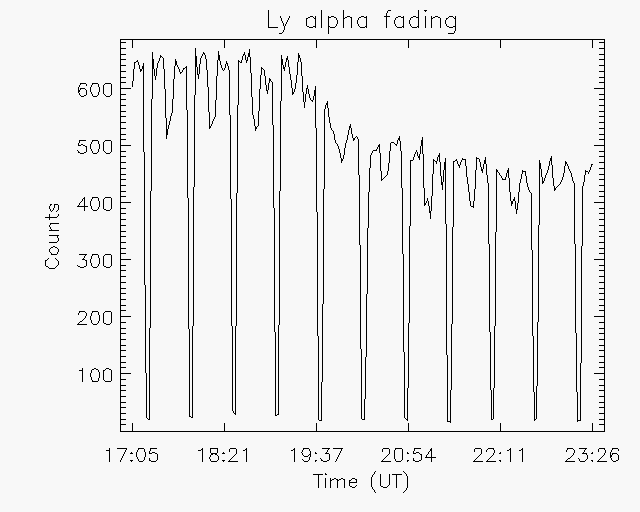
Fading in H I Ly alpha and O VI by ~15% due to void: Two different grating positions and two heights cause horizontal bars in intensity images.
Last Update Wed Oct 10 15:35:40 2012