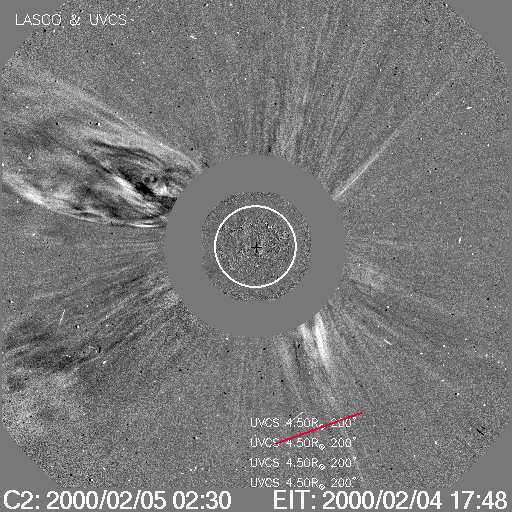
MOVIE of UVCS Slit on LASCO Images
CME 20000205
| Tutorials: UVCS CME Observations pdf / html | UVCS CME Catalog Pages html |
| Table 1 - General Information |
| CME ID |
Time (UT) |
PA (deg) |
Speed (km/sec) |
Acceleration (m/sec2) |
Mass (g) |
Type II RB |
X Flare |
| 20000205.012605.p211s |
01:26 |
215 |
502 |
49.5 |
4.4e+14 |
No |
Yes |
| Table 2 - UVCS Observation Sequence |
| FITS filename |
PA (deg) |
T i (UT) |
Tf (UT) |
Height (Rsun) |
Slit W. (arcsec) |
Exp. Time (sec) |
| d00.02.04.22:20:41.ovi.dat |
200 |
23:55:26 |
01:25:26 |
4.50 |
42 |
300 |
| 01:29:29 |
02:59:29 |
4.50 |
42 |
300 | ||
| 200 |
03:03:23 |
04:33:23 |
4.50 |
42 |
300 | |
| 04:37:25 |
06:07:25 |
4.50 |
42 |
300 |
| UVCS Slit Position |
|
MOVIE of UVCS Slit on LASCO Images |
| Table 3 - UVCS Observation Wavelength Range |
| FITS filename |
Wave Min (A) |
Wave Max (A) |
| d00.02.04.22:20:41.ovi.dat |
973.200 |
1071.30 |
| 1130.10 |
1220.50 |
| Table 4 - UV Properties |
| First Obs. | Max blue-shift (km/sec) | Max red-shift (km/sec) | Detected at (Rsun) | Lines |
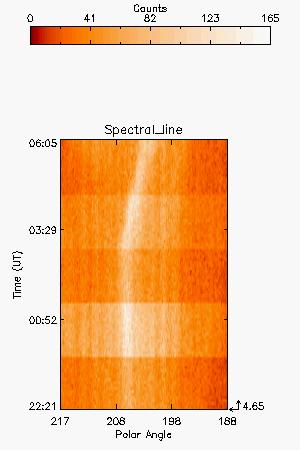
| 2000/02/04 03:00 | 0 | 0 | 4.65 |
HILya1216 |
| Images |
| Intensity Images |
||
| Interpretation |
| Front | No |
| Void | ? |
| Shock | No |
| Current Sheet | No |
| Prominence | No |
| Flare O VI | No |
| Leg | ? |
| Helix | No |
| Comments |
Narrow ray seen in Ly alpha brightens by 25% and shifts PA from 207 to 202 degrees.
Last Update Wed May 2 17:56:04 2012