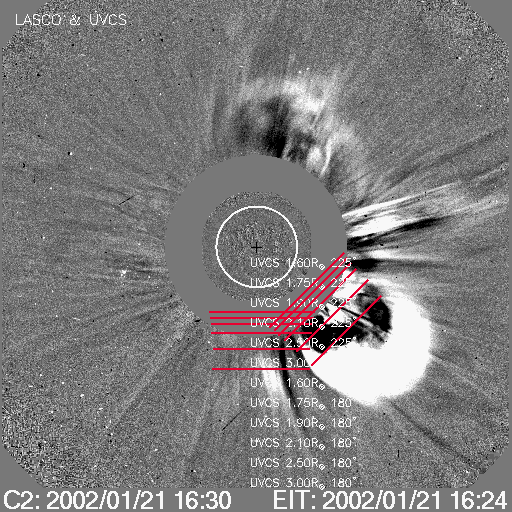
MOVIE of UVCS Slit on LASCO Images
CME 20020121
| Tutorials: UVCS CME Observations pdf / html | UVCS CME Catalog Pages html |
| Table 1 - General Information |
| CME ID |
Time (UT) |
PA (deg) |
Speed (km/sec) |
Acceleration (m/sec2) |
Mass (g) |
Type II RB |
X Flare |
| 20020121.153005.p231n |
15:30 |
229 |
508 |
-1.2 |
3.1e+15 |
No |
No |
| Table 2 - UVCS Observation Sequence |
| FITS filename |
PA (deg) |
T i (UT) |
Tf (UT) |
Height (Rsun) |
Slit W. (arcsec) |
Exp. Time (sec) |
| s02.01.21.15:46:21.ovi.dat |
180 |
15:46:52 |
16:00:52 |
3.00 |
42 |
120 |
| 16:04:17 |
16:28:17 |
2.50 |
42 |
120 | ||
| 180 |
16:31:59 |
16:45:59 |
2.10 |
42 |
120 | |
| 16:49:20 |
16:59:20 |
1.90 |
42 |
120 | ||
| 180 |
17:02:04 |
17:10:04 |
1.75 |
42 |
120 | |
| 17:12:01 |
17:16:01 |
1.60 |
42 |
120 | ||
| s02.01.21.17:21:00.ovi.dat |
225 |
17:21:31 |
17:35:31 |
3.00 |
42 |
120 |
| 17:38:45 |
18:02:45 |
2.50 |
42 |
120 | ||
| 225 |
18:06:29 |
18:20:29 |
2.10 |
42 |
120 | |
| 18:23:42 |
18:33:42 |
1.90 |
42 |
120 | ||
| 225 |
18:36:38 |
18:44:38 |
1.75 |
42 |
120 | |
| 18:46:35 |
18:50:35 |
1.60 |
42 |
120 |
| UVCS Slit Position |
|
MOVIE of UVCS Slit on LASCO Images |
| Table 3 - UVCS Observation Wavelength Range |
| FITS filename |
Wave Min (A) |
Wave Max (A) |
| s02.01.21.15:46:21.ovi.dat |
1024.20 |
1043.10 |
| 989.000 |
993.200 |
|
| 985.400 |
987.800 |
|
| 1204.00 |
1206.20 |
|
| 970.600 |
979.900 |
|
| 1211.30 |
1219.90 |
|
| s02.01.21.17:21:00.ovi.dat |
1024.20 |
1043.10 |
| 989.000 |
993.200 |
|
| 985.400 |
987.800 |
|
| 1204.00 |
1206.20 |
|
| 970.600 |
979.900 |
|
| 1211.30 |
1219.90 |
| Table 4 - UV Properties |
| First Obs. | Max blue-shift (km/sec) | Max red-shift (km/sec) | Detected at (Rsun) | Lines |
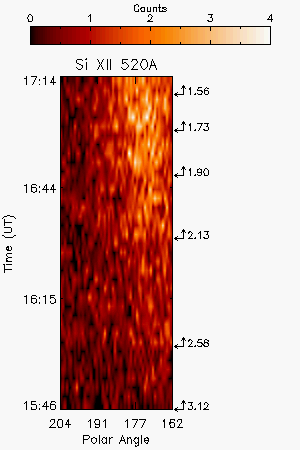
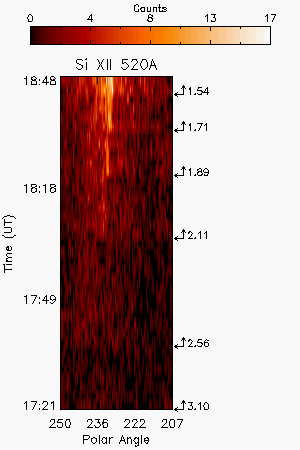
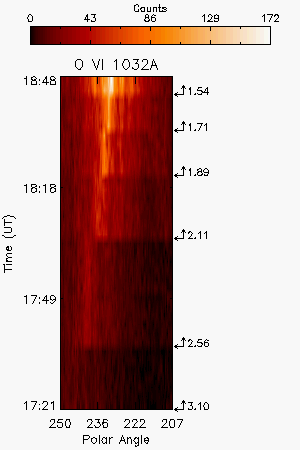
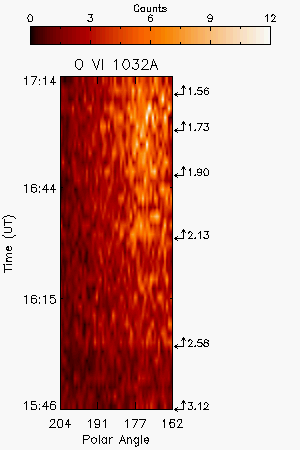
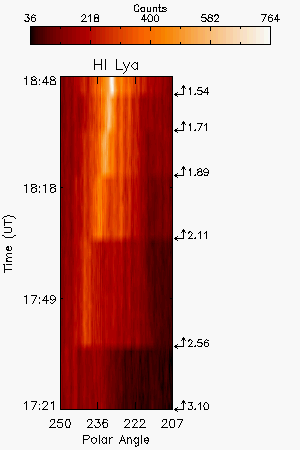
| 2002/01/21 16:32 | 2.13,1.90,1.73,1.56 (PA=180); 2.56,2.11,1.89,1.71,1.54 (PA=225) |
HILya1216 OVI1032 OVI1038 SiXII521 | ||
| Images |
| Intensity Images |
||||||
| Interpretation |
| Front | No |
| Void | No |
| Shock | No |
| Current Sheet | ? |
| Prominence | No |
| Flare O VI | No |
| Leg | No |
| Helix | No |
| Comments |
Observed first the ejecta south of the main CME. Later in the scan at PA=225 a narrow feature was detected at several heights
Last Update Mon May 7 10:24:29 2012