MOVIE of UVCS Slit on LASCO Images
CME 20021025
| Tutorials: UVCS CME Observations pdf / html | UVCS CME Catalog Pages html |
| Table 1 - General Information |
| CME ID |
Time (UT) |
PA (deg) |
Speed (km/sec) |
Acceleration (m/sec2) |
Mass (g) |
Type II RB |
X Flare |
| 20021025.222605.p074g |
22:26 |
61 |
494 |
1.0 |
1.3e+15 |
No |
No |
| Table 2 - UVCS Observation Sequence |
| FITS filename |
PA (deg) |
T i (UT) |
Tf (UT) |
Height (Rsun) |
Slit W. (arcsec) |
Exp. Time (sec) |
| d02.10.25.18:19:21.ovi.dat |
360 |
20:58:11 |
22:58:11 |
1.70 |
27 |
300 |
| 23:02:59 |
04:42:59 |
1.80 |
27 |
300 |
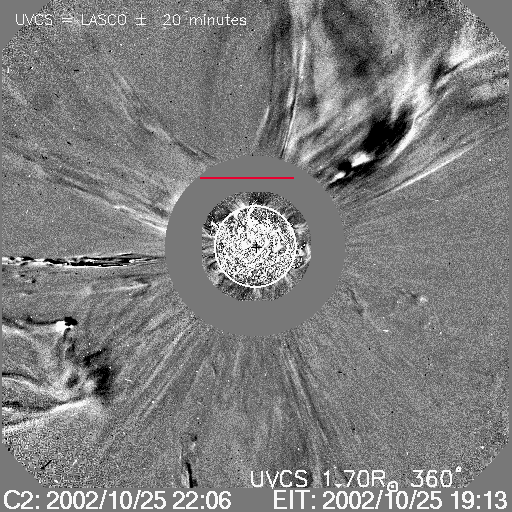
| UVCS Slit Position |
|
MOVIE of UVCS Slit on LASCO Images |
| Table 3 - UVCS Observation Wavelength Range |
| FITS filename |
Wave Min (A) |
Wave Max (A) |
| d02.10.25.18:19:21.ovi.dat |
1022.00 |
1044.10 |
| 997.000 |
1001.00 |
|
| 974.900 |
988.400 |
|
| 1211.20 |
1223.70 |
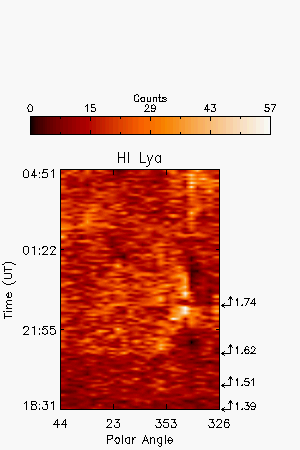
| Table 4 - UV Properties |
| First Obs. | Max blue-shift (km/sec) | Max red-shift (km/sec) | Detected at (Rsun) | Lines |
| 2002/10/26 01:22 | 1.74 |
HILya1216 OVI1032 OVI1038 | ||
| Images |
| Intensity Images |
||
| Interpretation |
| Front | No |
| Void | ? |
| Shock | No |
| Current Sheet | No |
| Prominence | ? |
| Flare O VI | No |
| Leg | No |
| Helix | No |
| Comments |
The Lya image shows two events. The one at 22:26 is responsible for the intensity variation toward the left end of the image.
Last Update Tue Sep 7 12:27:33 2010