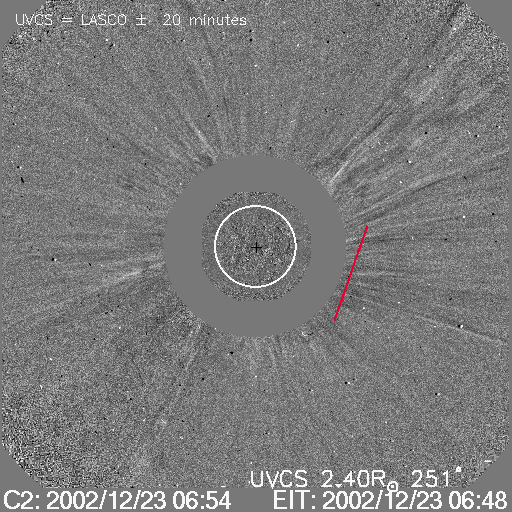
MOVIE of UVCS Slit on LASCO Images
CME 20021223
| Tutorials: UVCS CME Observations pdf / html | UVCS CME Catalog Pages html |
| Table 1 - General Information |
| CME ID |
Time (UT) |
PA (deg) |
Speed (km/sec) |
Acceleration (m/sec2) |
Mass (g) |
Type II RB |
X Flare |
| 20021223.073148.p273s |
07:31 |
269 |
351 |
10.9* |
2.6e+13* |
No |
No |
| Table 2 - UVCS Observation Sequence |
| FITS filename |
PA (deg) |
T i (UT) |
Tf (UT) |
Height (Rsun) |
Slit W. (arcsec) |
Exp. Time (sec) |
| d02.12.23.04:37:55.ovi.dat |
251 |
04:38:58 |
13:38:58 |
2.40 |
20 |
600 |
| UVCS Slit Position |
|
MOVIE of UVCS Slit on LASCO Images |
| Table 3 - UVCS Observation Wavelength Range |
| FITS filename |
Wave Min (A) |
Wave Max (A) |
| d02.12.23.04:37:55.ovi.dat |
1028.00 |
1043.00 |
| 997.200 |
1000.70 |
|
| 980.600 |
990.600 |
|
| 1211.10 |
1220.30 |
|
| 975.900 |
979.300 |
|
| 1221.50 |
1224.60 |
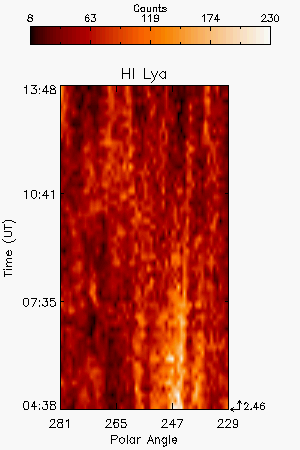
| Table 4 - UV Properties |
| First Obs. | Max blue-shift (km/sec) | Max red-shift (km/sec) | Detected at (Rsun) | Lines |
| 2002/12/23 07:24 UT | 2.46 |
HILya1216 OVI1032 OVI1038 | ||
| Images |
| Intensity Images |
||
| Interpretation |
| Front | No |
| Void | No |
| Shock | No |
| Current Sheet | No |
| Prominence | ? |
| Flare O VI | No |
| Leg | No |
| Helix | No |
| Comments |
Exposure time long, 10 min. The spectra also show line intensity variations due to some other earlier event which is not listed in LASCO catalog.
Last Update Mon Oct 11 10:39:24 2010