MOVIE of UVCS Slit on LASCO Images
CME 20021230
| Tutorials: UVCS CME Observations pdf / html | UVCS CME Catalog Pages html |
| Table 1 - General Information |
| CME ID |
Time (UT) |
PA (deg) |
Speed (km/sec) |
Acceleration (m/sec2) |
Mass (g) |
Type II RB |
X Flare |
| 20021230.110722.p079g |
11:07 |
79 |
605 |
-21.7* |
1.2e+14 |
No |
Yes |
| Table 2 - UVCS Observation Sequence |
| FITS filename |
PA (deg) |
T i (UT) |
Tf (UT) |
Height (Rsun) |
Slit W. (arcsec) |
Exp. Time (sec) |
| s02.12.30.11:06:40.ovi.dat |
90 |
11:07:13 |
11:17:13 |
1.75 |
41 |
120 |
| 11:20:01 |
11:28:01 |
1.60 |
41 |
120 |
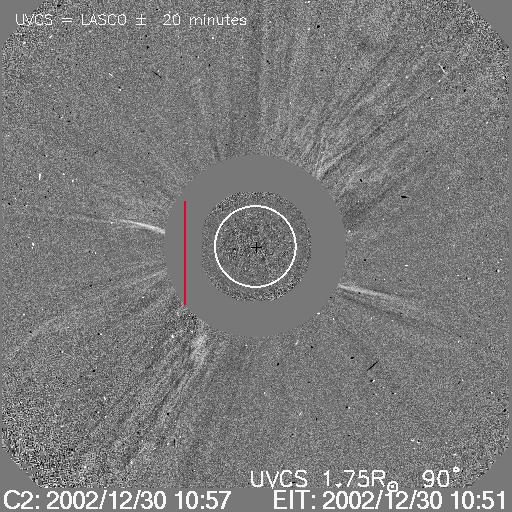
| UVCS Slit Position |
|
MOVIE of UVCS Slit on LASCO Images |
| Table 3 - UVCS Observation Wavelength Range |
| FITS filename |
Wave Min (A) |
Wave Max (A) |
| s02.12.30.11:06:40.ovi.dat |
1024.40 |
1042.70 |
| 966.600 |
978.900 |
|
| 1204.70 |
1216.10 |
| Table 4 - UV Properties |
| First Obs. | Max blue-shift (km/sec) | Max red-shift (km/sec) | Detected at (Rsun) | Lines |
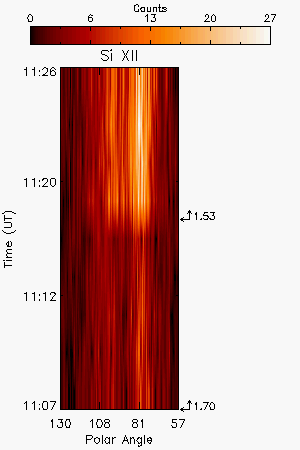
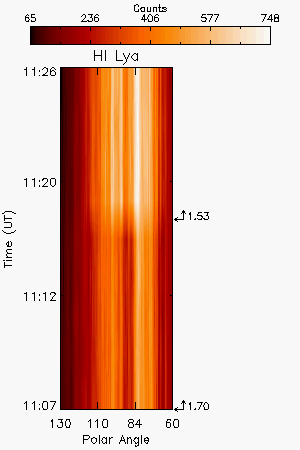
| 2002/12/30 11:07 | 1.53,1.70 |
HILya1216 HILyb1026 OVI1032 OVI1038 SiXII521 |
||
| Images |
| Intensity Images |
|||
| Interpretation |
| Front | No |
| Void | No |
| Shock | No |
| Current Sheet | No |
| Prominence | Yes |
| Flare O VI | No |
| Leg | No |
| Helix | No |
| Comments |
Narrow CME detected as line intensity variation
Last Update Fri Aug 19 21:36:35 2011