MOVIE of UVCS Slit on LASCO Images
CME 20030121
| Tutorials: UVCS CME Observations pdf / html | UVCS CME Catalog Pages html |
| Table 1 - General Information |
| CME ID |
Time (UT) |
PA (deg) |
Speed (km/sec) |
Acceleration (m/sec2) |
Mass (g) |
Type II RB |
X Flare |
| 20030121.212105.p293g |
21:21 |
301 |
669 |
28.1 |
3.3e+14 |
No |
No |
| Table 2 - UVCS Observation Sequence |
| FITS filename |
PA (deg) |
T i (UT) |
Tf (UT) |
Height (Rsun) |
Slit W. (arcsec) |
Exp. Time (sec) |
| d03.01.21.16:55:00.ovi.dat |
359 |
17:54:46 |
20:54:46 |
2.00 |
13 |
600 |
| 17:54:46 |
20:54:46 |
2.00 |
13 |
600 | ||
| d03.01.21.21:01:12.ovi.dat |
0 |
21:02:11 |
03:02:11 |
2.40 |
21 |
600 |
| 21:02:11 |
03:02:11 |
2.40 |
21 |
600 |
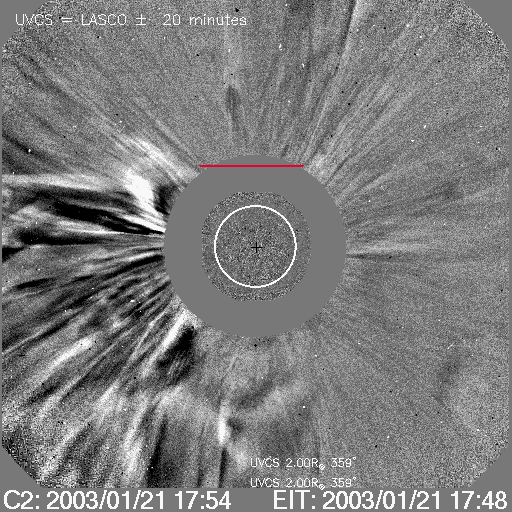
| UVCS Slit Position |
|
MOVIE of UVCS Slit on LASCO Images |
| Table 3 - UVCS Observation Wavelength Range |
| FITS filename |
Wave Min (A) |
Wave Max (A) |
| d03.01.21.16:55:00.ovi.dat |
1028.00 |
1043.00 |
| 997.200 |
1000.70 |
|
| 980.600 |
990.600 |
|
| 1211.10 |
1220.30 |
|
| 975.900 |
979.300 |
|
| 1221.50 |
1224.60 |
|
| d03.01.21.21:01:12.ovi.dat |
1028.00 |
1043.00 |
| 997.200 |
1000.70 |
|
| 980.600 |
990.600 |
|
| 1211.10 |
1220.30 |
|
| 975.900 |
979.300 |
|
| 1221.50 |
1224.60 |
| Table 4 - UV Properties |
| First Obs. | Max blue-shift (km/sec) | Max red-shift (km/sec) | Detected at (Rsun) | Lines |
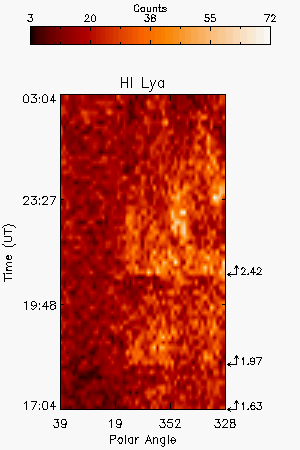
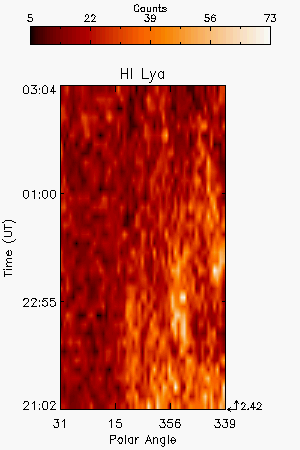
| 2003/01/21 20:50 | 0 | 0 | 2.42 |
HILya1216 OVI1032 OVI1038 |
| Images |
| Intensity Images |
|||
| Interpretation |
| Front | No |
| Void | Yes |
| Shock | No |
| Current Sheet | No |
| Prominence | ? |
| Flare O VI | No |
| Leg | ? |
| Helix | No |
| Comments |
Data not easy to be linked to LASCO CMEs beacuse of the gap of more that 2 hours in LASCO data
Last Update Tue Dec 1 12:17:52 2009