MOVIE of UVCS Slit on LASCO Images
CME 20030326
| Tutorials: UVCS CME Observations pdf / html | UVCS CME Catalog Pages html |
| Table 1 - General Information |
| CME ID |
Time (UT) |
PA (deg) |
Speed (km/sec) |
Acceleration (m/sec2) |
Mass (g) |
Type II RB |
X Flare |
| 20030326.033005.p221g |
03:30 |
228 |
700 |
2.3 |
7.4e+14 |
No |
Yes |
| Table 2 - UVCS Observation Sequence |
| FITS filename |
PA (deg) |
T i (UT) |
Tf (UT) |
Height (Rsun) |
Slit W. (arcsec) |
Exp. Time (sec) |
| d03.03.25.22:32:42.ovi.dat |
194 |
22:33:42 |
04:33:42 |
2.40 |
21 |
600 |
| d03.03.26.04:46:36.ovi.dat |
192 |
04:48:12 |
05:18:12 |
1.70 |
13 |
300 |
| d03.03.26.05:21:10.ovi.dat |
194 |
05:22:14 |
14:12:14 |
2.40 |
21 |
600 |
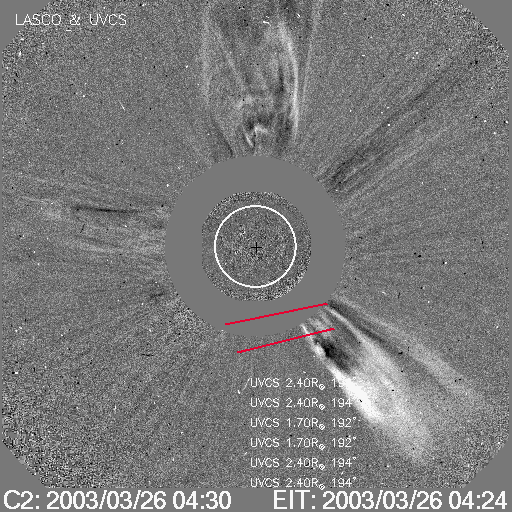
| UVCS Slit Position |
|
MOVIE of UVCS Slit on LASCO Images |
| Table 3 - UVCS Observation Wavelength Range |
| FITS filename |
Wave Min (A) |
Wave Max (A) |
| d03.03.25.22:32:42.ovi.dat |
1028.00 |
1043.00 |
| 997.200 |
1000.70 |
|
| 980.600 |
990.600 |
|
| 1211.10 |
1220.30 |
|
| 975.900 |
979.300 |
|
| 1221.50 |
1224.60 |
|
| d03.03.26.04:46:36.ovi.dat |
1028.00 |
1043.00 |
| 997.200 |
1000.70 |
|
| 980.600 |
990.600 |
|
| 1211.10 |
1220.30 |
|
| 975.900 |
979.300 |
|
| 1221.50 |
1224.60 |
|
| d03.03.26.05:21:10.ovi.dat |
1028.00 |
1043.00 |
| 997.200 |
1000.70 |
|
| 980.600 |
990.600 |
|
| 1211.10 |
1220.30 |
|
| 975.900 |
979.300 |
|
| 1221.50 |
1224.60 |
| Table 4 - UV Properties |
| First Obs. | Max blue-shift (km/sec) | Max red-shift (km/sec) | Detected at (Rsun) | Lines |
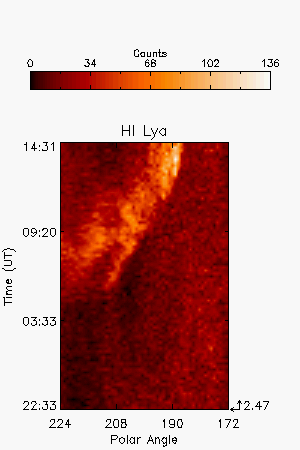
| 2003/03/26 04:25 | 2.47(PA=194);1.67(PA=192);2.47(PA=194) |
HILya1216 | ||
| Images |
| Intensity Images |
||
| Interpretation |
| Front | Yes |
| Void | Yes |
| Shock | ? |
| Current Sheet | No |
| Prominence | ? |
| Flare O VI | No |
| Leg | Yes |
| Helix | No |
| Comments |
Exposure time 600 sec.
Last Update Tue May 8 16:19:37 2012