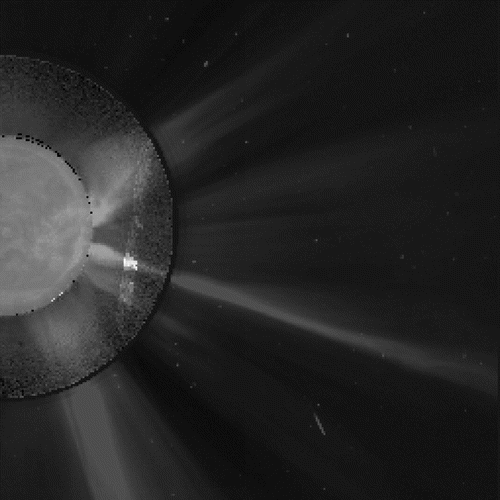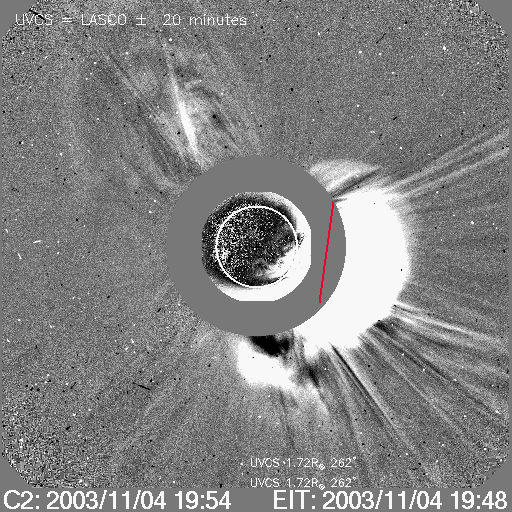
MOVIE of UVCS Slit on LASCO Images
CME 20031104
| Tutorials: UVCS CME Observations pdf / html | UVCS CME Catalog Pages html |
| Table 1 - General Information |
| CME ID |
Time (UT) |
PA (deg) |
Speed (km/sec) |
Acceleration (m/sec2) |
Mass (g) |
Type II RB |
X Flare |
| 20031104.195405.p260s |
19:54 |
Halo |
2657 |
434.8* |
1.7e+16* |
Yes |
Yes |
| Table 2 - UVCS Observation Sequence |
| FITS filename |
PA (deg) |
T i (UT) |
Tf (UT) |
Height (Rsun) |
Slit W. (arcsec) |
Exp. Time (sec) |
| d03.11.04.17:18:40.ovi.dat |
262 |
17:18:39 |
19:56:39 |
1.72 |
26 |
120 |
| d03.11.04.20:12:28.ovi.dat |
262 |
20:12:28 |
22:52:28 |
1.72 |
26 |
120 |
| d03.11.04.23:06:11.ovi.dat |
262 |
23:06:11 |
01:46:11 |
1.72 |
26 |
120 |
| d03.11.05.01:59:56.ovi.dat |
262 |
01:59:56 |
04:39:56 |
1.72 |
26 |
120 |
| s03.11.05.13:02:38.ovi.dat |
270 |
13:03:11 |
13:17:11 |
3.00 |
41 |
120 |
| 270 |
13:20:30 |
13:44:30 |
2.50 |
41 |
120 | |
| 270 |
13:48:00 |
14:02:00 |
2.10 |
41 |
120 | |
| 270 |
14:05:16 |
14:15:16 |
1.90 |
41 |
120 | |
| 270 |
14:18:01 |
14:26:01 |
1.75 |
41 |
120 | |
| 270 |
14:28:02 |
14:32:02 |
1.60 |
41 |
120 |
| UVCS Slit Position |
|
MOVIE of UVCS Slit on LASCO Images |
| Table 3 - UVCS Observation Wavelength Range |
| FITS filename |
Wave Min (A) |
Wave Max (A) |
| d03.11.04.17:18:40.ovi.dat |
1024.00 |
1043.20 |
| 998.200 |
1008.90 |
|
| 991.200 |
994.700 |
|
| 967.200 |
981.100 |
|
| 943.700 |
965.100 |
|
| 1171.80 |
1191.60 |
|
| d03.11.04.20:12:28.ovi.dat |
1024.00 |
1043.20 |
| 998.200 |
1008.90 |
|
| 991.200 |
994.700 |
|
| 967.200 |
981.100 |
|
| 943.700 |
965.100 |
|
| 1171.80 |
1191.60 |
|
| d03.11.04.23:06:11.ovi.dat |
1024.00 |
1043.20 |
| 998.200 |
1008.90 |
|
| 991.200 |
994.700 |
|
| 967.200 |
981.100 |
|
| 943.700 |
965.100 |
|
| 1171.80 |
1191.60 |
|
| d03.11.05.01:59:56.ovi.dat |
1024.00 |
1043.20 |
| 998.200 |
1008.90 |
|
| 991.200 |
994.700 |
|
| 967.200 |
981.100 |
|
| 943.700 |
965.100 |
|
| 1171.80 |
1191.60 |
|
| s03.11.05.13:02:38.ovi.dat |
1024.30 |
1042.80 |
| 967.500 |
979.700 |
|
| 1205.90 |
1217.00 |
| Table 4 - UV Properties |
| First Obs. | Max blue-shift (km/sec) | Max red-shift (km/sec) | Detected at (Rsun) | Lines |
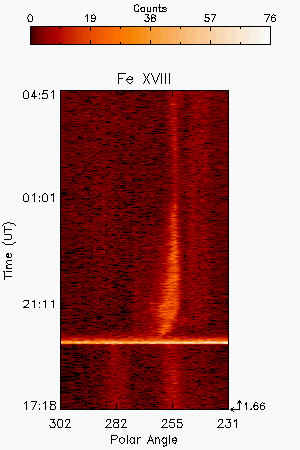
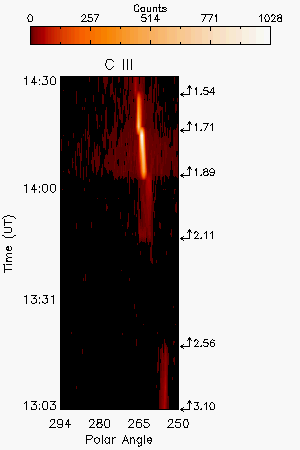
| 2003/11/04 19:54 | 400 | 1.67 (PA=245), 3.1, 2.11,1.89,1.71,1.54 (PA=270) |
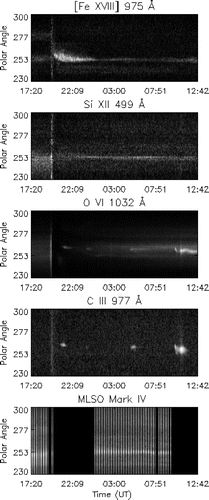
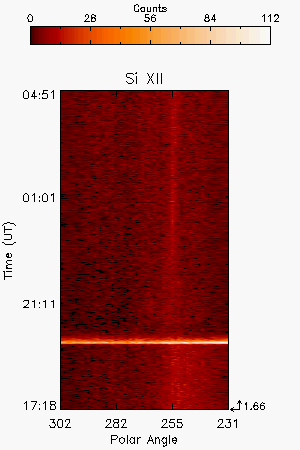
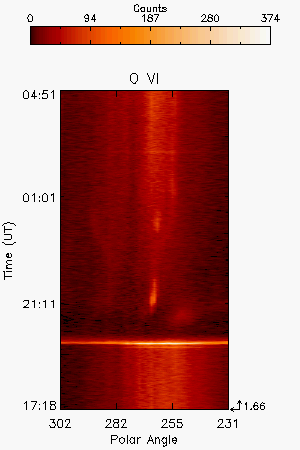
HILya1216 HILyb1026 FeXVIII975 CIII977 OVI1032 OVI1038 SiXII499 | |
| Images |
| Intensity Images |
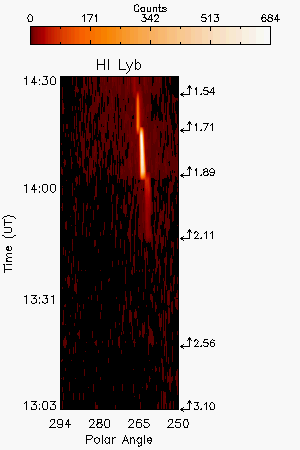
C III 977A intensity image showing the ejecta detected during the synoptic scan at PA=270 |
H I Lyb 1026A intensity image showing the ejecta detected during the synoptic scan at PA=270 |
||||||
| Interpretation |
| Front | Yes |
| Void | No |
| Shock | ? |
| Current Sheet | Yes |
| Prominence | Yes |
| Flare O VI | Yes |
| Leg | No |
| Helix | No |
| Publications |
Raymond et al. 2007, ApJ, 659, 750; Ciaravella & Raymond 2008, ApJ, 686, 1372; Johnson et al. 2011, ApJ, 735, 70
| Comments |
High background starting at 19:33 UT corresponding to the X-ray flare. Later ejecta of cold material has also been detected during the synoptic scan on Nov 5th at PA=270
Last Update Wed Oct 10 10:06:56 2012