MOVIE of UVCS Slit on LASCO Images
CME 20031118
| Tutorials: UVCS CME Observations pdf / html | UVCS CME Catalog Pages html |
| Table 1 - General Information |
| CME ID |
Time (UT) |
PA (deg) |
Speed (km/sec) |
Acceleration (m/sec2) |
Mass (g) |
Type II RB |
X Flare |
| 20031118.095005.p087s |
09:50 |
95 |
1824 |
59.6 |
2.2e+16* |
No |
Yes |
| Table 2 - UVCS Observation Sequence |
| FITS filename |
PA (deg) |
T i (UT) |
Tf (UT) |
Height (Rsun) |
Slit W. (arcsec) |
Exp. Time (sec) |
| s03.11.18.10:02:39.ovi.dat |
90 |
10:03:14 |
10:13:14 |
1.75 |
41 |
120 |
| 90 |
10:16:12 |
10:24:12 |
1.60 |
41 |
120 | |
| s03.11.18.10:29:26.ovi.dat |
135 |
10:29:59 |
10:39:59 |
1.75 |
41 |
120 |
| 135 |
10:42:45 |
10:50:45 |
1.60 |
41 |
120 |
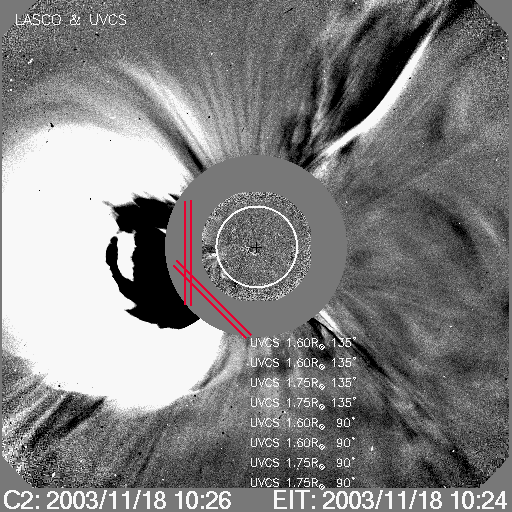
| UVCS Slit Position |
|
MOVIE of UVCS Slit on LASCO Images |
| Table 3 - UVCS Observation Wavelength Range |
| FITS filename |
Wave Min (A) |
Wave Max (A) |
| s03.11.18.10:02:39.ovi.dat |
1024.20 |
1043.10 |
| 989.000 |
993.200 |
|
| 985.400 |
987.800 |
|
| 1204.10 |
1206.20 |
|
| 970.600 |
979.900 |
|
| 1211.30 |
1219.90 |
|
| s03.11.18.10:29:26.ovi.dat |
1024.20 |
1043.10 |
| 989.000 |
993.200 |
|
| 985.400 |
987.800 |
|
| 1204.10 |
1206.20 |
|
| 970.600 |
979.900 |
|
| 1211.30 |
1219.90 |
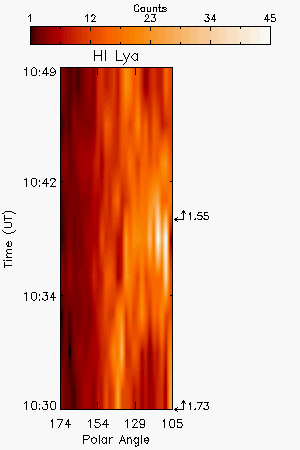
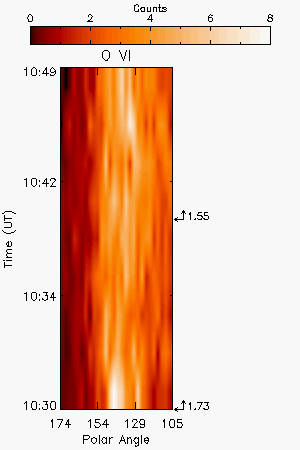
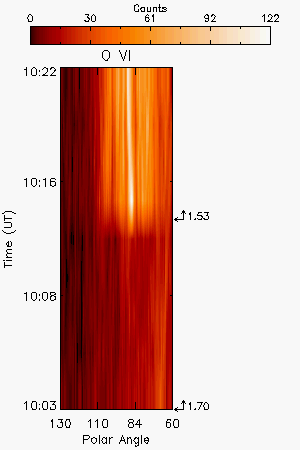
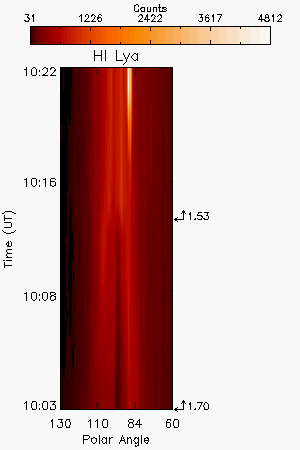
| Table 4 - UV Properties |
| First Obs. | Max blue-shift (km/sec) | Max red-shift (km/sec) | Detected at (Rsun) | Lines |
| 2003/11/18 10:03 | 115 | 1.70,1.53 (PA=90); 1.73,1.55 (PA=135) |
HILya1216 HILyb1026 CIII977 OVI1032 OVI1038 SiIII1207 NIII990 | |
| Images |
| Intensity Images |
|||||
| Interpretation |
| Front | ? |
| Void | ? |
| Shock | ? |
| Current Sheet | Yes |
| Prominence | Yes |
| Flare O VI | ? |
| Leg | ? |
| Helix | ? |
| Publications |
Lin J. et al. 2005, ApJ,662,1251
| Comments |
The gap in H I Ly-alpha image at 1.70 R (PA=90) that gradually disappeared as result of the reconnection inflow near the current sheet
Last Update Thu May 10 14:40:43 2012