MOVIE of UVCS Slit on LASCO Images
CME 20040713
| Tutorials: UVCS CME Observations pdf / html | UVCS CME Catalog Pages html |
| Table 1 - General Information |
| CME ID |
Time (UT) |
PA (deg) |
Speed (km/sec) |
Acceleration (m/sec2) |
Mass (g) |
Type II RB |
X Flare |
| 20040713.005405.p213s |
00:54 |
313 |
607 |
-2.2* |
1.8e+14 |
Yes |
Yes |
| Table 2 - UVCS Observation Sequence |
| FITS filename |
PA (deg) |
T i (UT) |
Tf (UT) |
Height (Rsun) |
Slit W. (arcsec) |
Exp. Time (sec) |
| d04.07.12.23:48:23.ovi.dat |
305 |
23:48:53 |
00:48:53 |
2.58 |
41 |
50 |
| 00:54:13 |
01:54:13 |
2.73 |
41 |
50 | ||
| d04.07.13.02:02:30.ovi.dat |
340 |
02:03:00 |
03:02:10 |
1.85 |
41 |
50 |
| 03:08:20 |
04:08:20 |
1.93 |
41 |
50 | ||
| 340 |
04:13:40 |
05:13:40 |
2.06 |
41 |
50 |
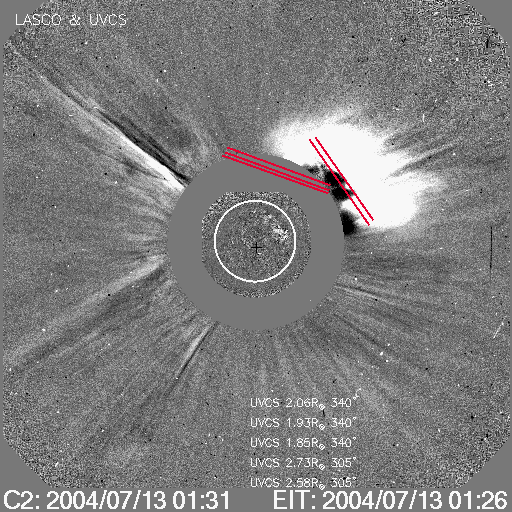
| UVCS Slit Position |
|
MOVIE of UVCS Slit on LASCO Images |
| Table 3 - UVCS Observation Wavelength Range |
| FITS filename |
Wave Min (A) |
Wave Max (A) |
| d04.07.12.23:48:23.ovi.dat |
970.900 |
976.700 |
| 1211.60 |
1216.90 |
|
| d04.07.13.02:02:30.ovi.dat |
970.900 |
976.700 |
| 1211.60 |
1216.90 |
| Table 4 - UV Properties |
| First Obs. | Max blue-shift (km/sec) | Max red-shift (km/sec) | Detected at (Rsun) | Lines |
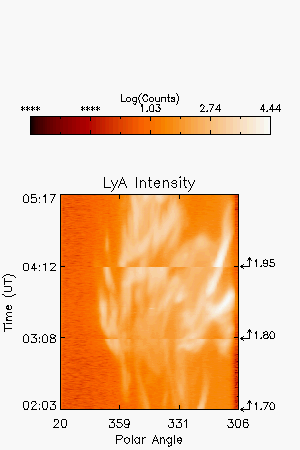
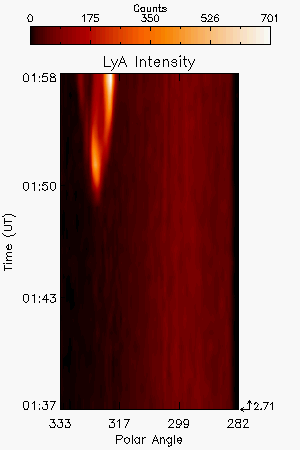
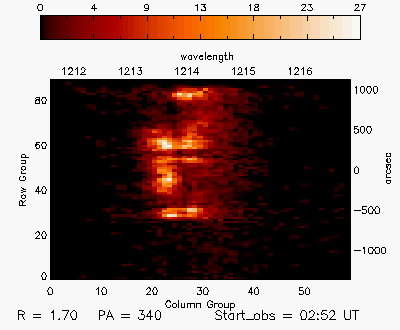
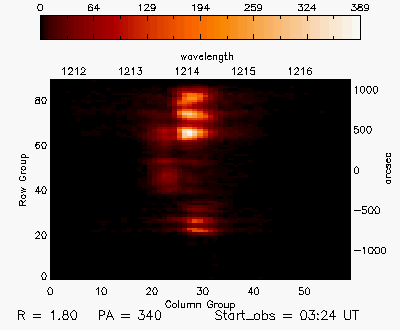
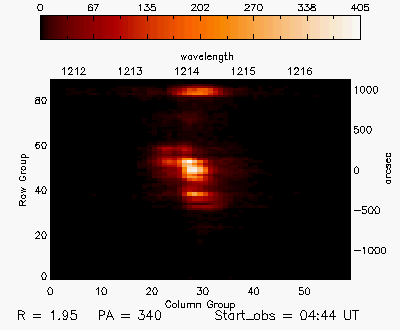
| 2004/07/13 01:50 | 474 | 22 | 2.71,1.70,1.80,1.95 |
HILya1216 CIII977 |
| Images |
| Intensity Images |
|||
| Plots and more |
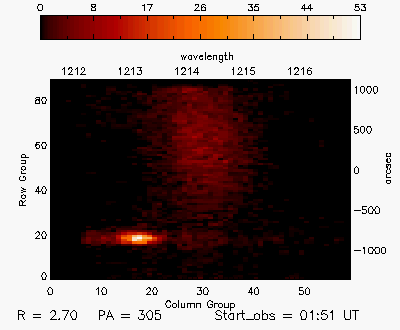
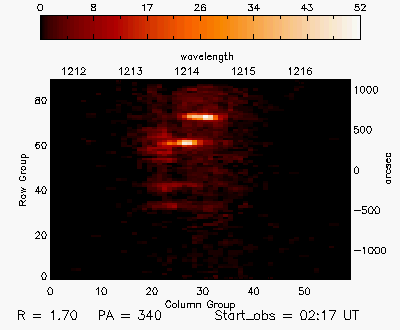
Sample exposure showing complicated structure and line shift |
Sample exposure showing complicated structure and line shift |
Sample expsoure showing complicated structure and line shift |
|||
| Interpretation |
| Front | ? |
| Void | No |
| Shock | No |
| Current Sheet | No |
| Prominence | Yes |
| Flare O VI | No |
| Leg | Yes |
| Helix | ? |
| Comments |
Some of the 2.71 Rs exposures can be C III too. Care should be taken when ananlyzing the data to identify which blob comes from which line emission.
Last Update Wed Nov 18 12:29:52 2009